
Sales Dashboard - Everything You Need to Know and 3 Templates!

For your business to make informed decisions, it’s essential to count on a document that gives invaluable insight into qualified leads, the average number of closed deals, new deals, revenue, profit, and more. This document that offers all this information and a bigger picture of the sales process is a Sales Dashboard. In this article, we will address everything about this topic and give you some pre-built templates you can use to take your organization to the next level.
Sales Dashboard - Everything You Need to Know and 3 Templates!
What Is a Sales Dashboard?
A sales performance dashboard is a visual representation of your sales data. It provides an overview of the KPIs your organization uses to measure the success of sales or projects. Among the common metrics, these key performance indicators are:
Revenue;
Quota attainment;
Average deal size;
Percentage of conversions;
Sales funnel leakage.
Sales performance dashboards provide enough information for the sales team to check and track the sales process. This way, they can know if the company is growing and if other teams are reaching sales goals.
Based on this, they can offer incentives, award bonuses, improve sales strategies and even create new processes for sales teams.
Why Are Sales Dashboards Crucial for Your Organization?
Sales Dashboards are like microscopes showing a high-level view of any of the most critical sales process factors. Thanks to this document, sales managers can recognize areas of success and weaknesses that must be addressed. They can also identify opportunities and forecast possible issues and sales blockers.
Furthermore, a sales dashboard also helps your organization's team to measure different aspects of the sales process, such as accountability and visibility. In other words, a sales dashboard:
Allows you to have strong ownership of your pipelines and accurate information;
Simplifies KPIs, such as the team's performance, sales opportunities, closed deals, etcetera.
Helps sales reps and sales leaders to navigate all the tasks easily.
The sales rep can forecast and compare data to check profits and revenue.
Provides a real-time overview of targets and progress by sharing information with key stakeholders.
Types of Sales Dashboards
Although a sales dashboard may give a lot of information about the sales process to sales representatives, it can specialize in some aspects. For instance, a sales dashboard can focus on performance or the sales cycle length. Below we're providing you with some sales dashboard examples. You can adopt the best one for your purposes and create a sales dashboard of your preference.
Sales Performance Dashboard
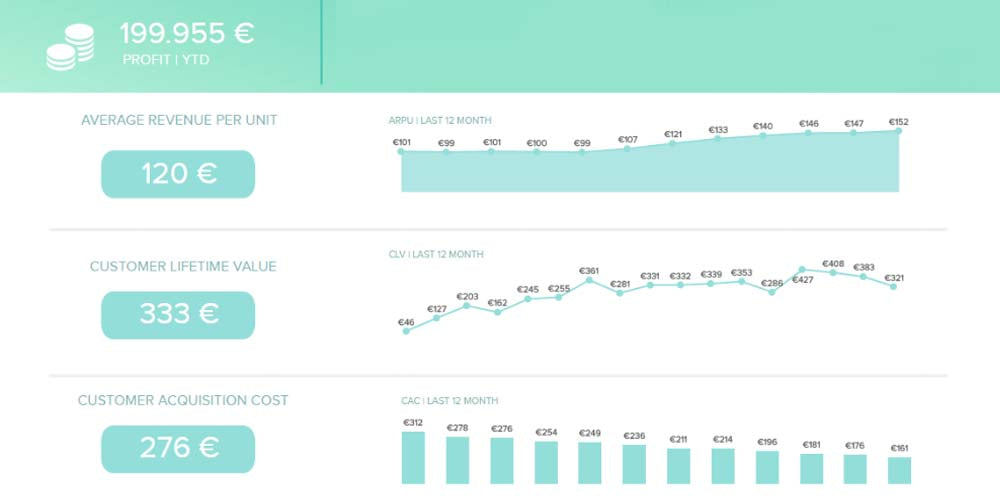
This document showcases, through a series of charts, the sales growth, the average revenue per unit, the customer lifetime value, and acquisition cost, among other data. Thanks to this, the sales manager and sales team members can easily understand the sales pipeline and the effectiveness of their adopted sales strategies. This document can also be named a sales growth dashboard.
Sales KPI Dashboard
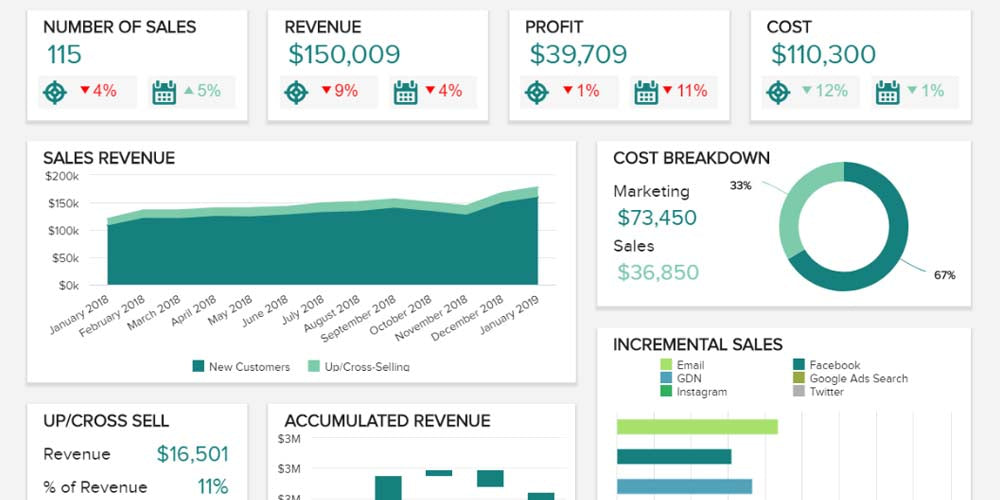
This type of sales dashboard focuses on high-level sales metrics crucial for sales executives, c-level experts, leaders, and sales VPs. Among all the modern sales dashboards, this document strongly focuses on key performance indicators (KPIs), giving important metrics of all data points crucial for the success of operations.
Besides, it exposes the most relevant operational and actionable sales data needed for successfully running the sales department. Furthermore, as you can see in the sales dashboard example above, it highlights numbers of sales, revenue, profit, cost, incremental sales, and more.
Sales Cycle Length Dashboard
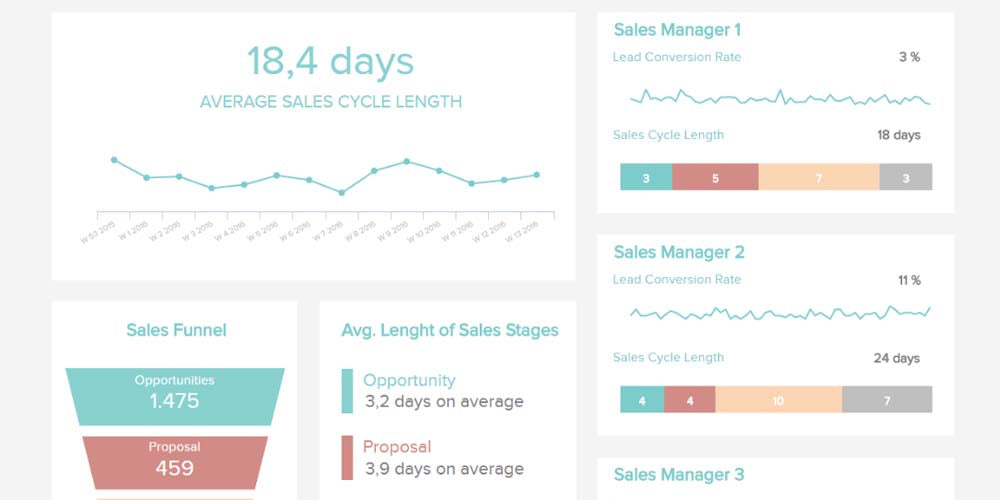
As its name suggests, this sales rep dashboard focuses on showing the average sales cycle length by indicating the lead conversion rate per individual sales rep. Besides, it also showcases the effective general sales that data-driven sales teams have achieved in the cycle, considering the average length of sales stages, i.e., opportunity, proposal, negotiation, and closing.
It reflects the time it takes to go from an opportunity to make a sale. With this information, your team or the sales leader can create new sales efforts to minimize the average length and convert some sales leads into real customers. Finally, it also provides a sales overview through key metrics.
Sales Conversion Dashboard
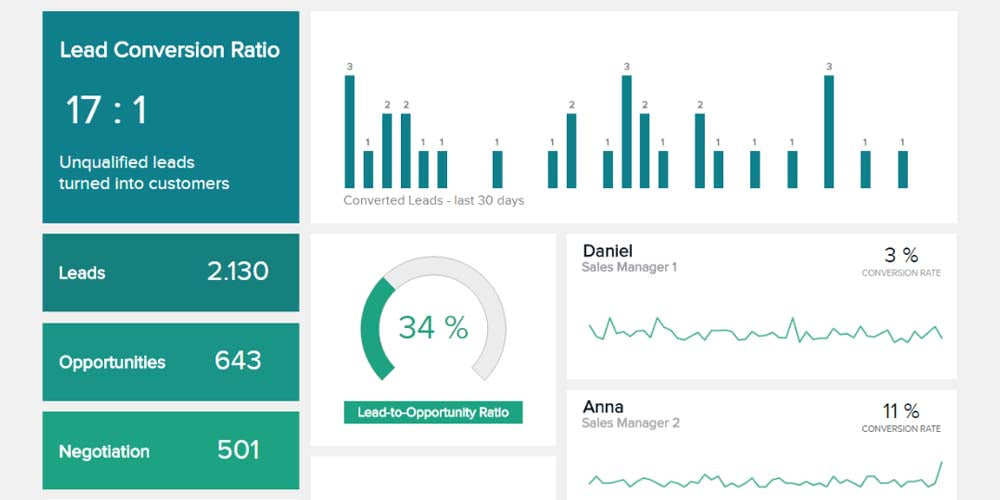
The sales conversion dashboard allows you to look in detail at each stage of the sales cycle, i.e., ascertaining potential leads, turning them into opportunities, ending with sales/wins, etcetera. It provides your sales organization with raw data for subsequent analysis and visualization of different aspects of the sales conversion process.
It focuses on the lead-opportunity ratio, showing you if your salespeople are effective. This pipeline dashboard also showcases which stages need improvements and which you can repeat for similar results. In a few words, it allows you to easily track your whole conversion funnel with real-time information.
Sales Opportunity Dashboard
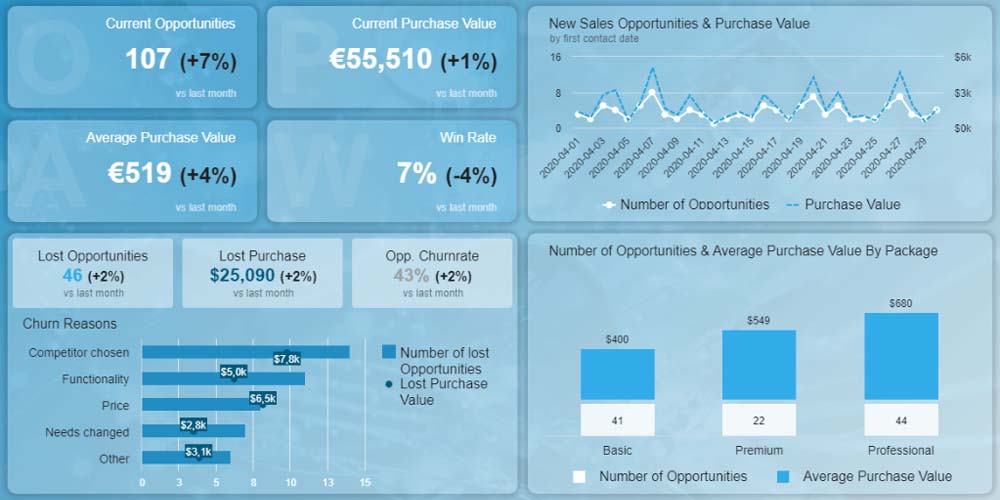
This dashboard focuses on the most promising leads in your funnel, helping the individual sales representative to get data about sales opportunities in one sales leaderboard. The average purchase value, the current number of potential leads, the churn rate, etcetera – everything is straightforward thanks to a visual appeal that facilitates the reading.
This dashboard compares current numbers with the last month's results to get an insight into the growth and how much revenue your organization earns. Besides, it depicts information through one period, showcasing pikes of value. It can be handy for future marketing tactics since you can investigate what happened in those periods, to try to repeat the process.
Sales Analysis Dashboard
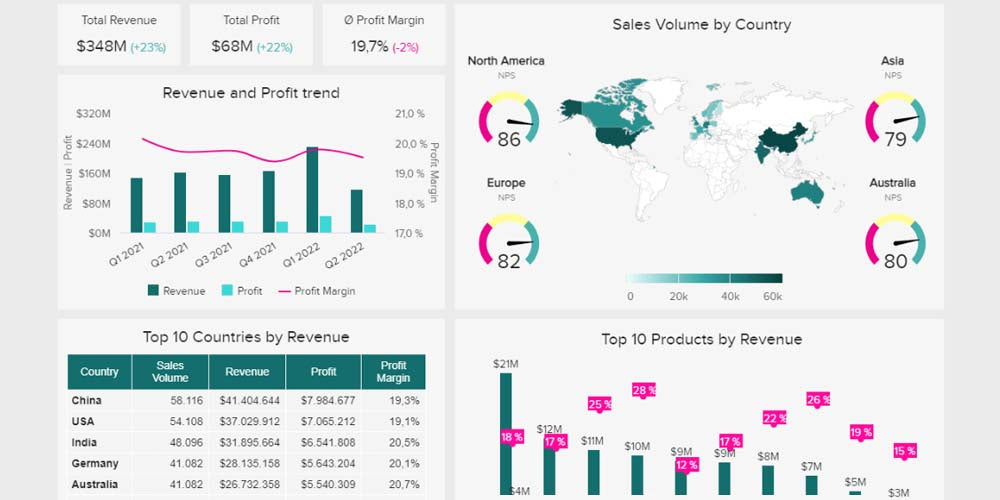
This sales dashboard has a B2C focus, covering all the key products and region metrics crucial to monitor and optimize strategies for steady growth. A dashboard of this nature allows you to easily explore critical and specific data according to country, region, sales representative, and period.
Besides, this dashboard helps your representative check the key products by revenue. They can quickly identify items that are not working and implement strategies to increase the total revenue.
Creating a Sales Dashboard - A Step-by-Step Guide
You can create dashboards in five simple steps. If you already have the data, a sales dashboard software or MS Excel will make the work on your behalf easier!
1. Define the Sales Metrics You’ll Use
Since a sales dashboard shows the most important KPIs related to the sales of your organization, the first step is to define which KPIs are crucial for those purposes. To know the KPIs you need, you should ask yourself the following questions:
What metrics do your team sales use regularly?
Do your organization have multiple sales teams in charge of different processes?
Some of the metrics you should consider are the following:
Sales metrics;
Lead generation sales metrics;
Sales outreach metrics;
Sales process metrics.
Sales growth;
Acquisition costs;
Revenue per sales rep;
Customer churn rate;
Incremental sales by campaign;
Lead conversion rate;
Number of sales opportunities;
Average purchase value;
Revenue and profit by product.
2. Determine How Your Organization Will Use the Dashboard
Above, we shared several types of sales dashboards and how they focus on different aspects of the sales process. Consider what your organization will use the examples and templates for. In other words, define what KPIs to track to measure results and the sales team's performance.
A one-size-fits-all sales dashboard doesn’t exist! You need to design or edit the best for your purposes!
You can design your own sales dashboards focused on tracking the sales target progress of sales reps and their monthly quota. You can even lead your dashboard toward a specific product.
Some questions you should ask yourself are the following:
To whom is the document referring to?
How often will the document be reviewed?
What data-driven decisions people in charge will make with the document?
What information do representatives want to see in the effective sales dashboards?
3. Pick a Sales Dashboard Provider
If you're currently using a CMR (customer relationship management), you likely already know that software of this nature provides you with a sales reporting dashboard. Still, if you want to avoid picking or hiring a sales dashboard provider, you can use the templates we share below without needing to collect CRM data. Some recommended providers are:
Hubspot;
Klipfolio;
Slemma;
Zoho Analytics;
Visible;
TapClicks.
4. Pull Data Into the Dashboard
Most services and Excel templates will allow you to sync data to generate sales reports and dashboards easily. This is one of the benefits of using CRM software. These reports are crucial to track sales performance, forecasting future sales, identifying top-performing sales reps, and much more.
On the other hand, if you use a spreadsheet document, you'll have to manage the process manually, which brings advantages and disadvantages. The main advantage is that you have better and more significant control regarding data. A clear disadvantage is that syncing information can take a long time.
But do not worry! Below we share some templates that you can easily download and edit. That being said, you will need Microsoft Office to leverage the full potential of the most critical metrics those templates offer.
Luckily, here at RoyalCDKeys, we're allowing you to get a reliable copy of Microsoft Office 2021 Professional Plus Key Retail Global at an incredible price.
Thanks to this suite and all its tools and resources, you can quickly create and organize an interactive dashboard for your team members to extract all needed data to improve sales processes.
5. Build The Sales Dashboard Report
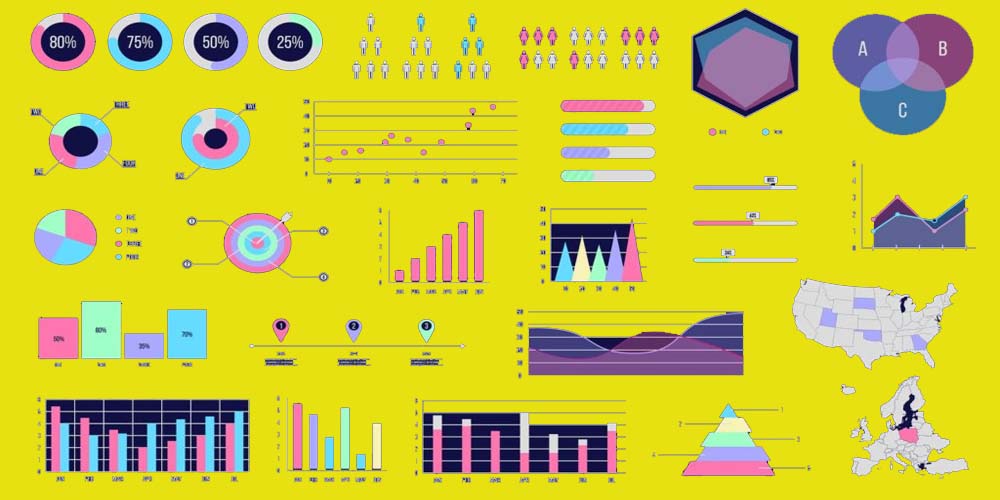
Since sales dashboards provide information visually, you must select the best way of showcasing values, total sales, revenue goals, average purchase value, etcetera. Depending on the crucial data you need, you can select from a wide range of charts to correctly visualize and analyze data. Among these:
Pie chart;
Bar chart;
Area chart;
Doughnut chart;
Comparison chart;
Column chart.
The charts you use should showcase real-time data quickly and be easy to understand at a glance. For example, a column or a dual-axis line chart is recommended if you need to explain trends–such as revenue growth–in your company's sales process. On the other hand, if you want to compare the average value from different periods or territories, you can choose line graphs, column charts, bar charts, or scatter plots.
Sales Dashboard Templates
In this section, we’re sharing three attractive templates you can use to have a complete picture of the driving sales of your company.
Sales Management Dashboard Template
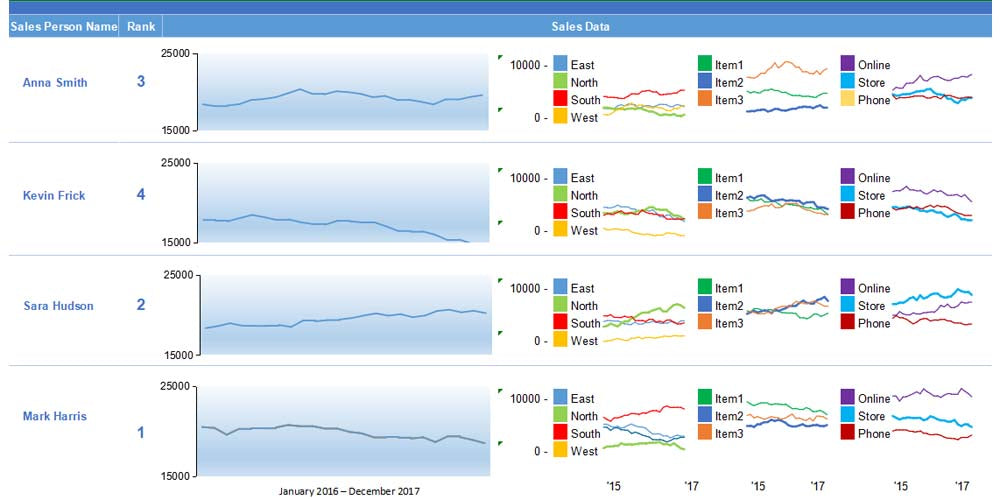
This sales dashboard template is designed to track the sales performance of the salespeople of your team or item. Through line graphs, you can analyze lows and highs in trends, and even in what part of the process the salesperson lost deals. This document also integrates column charts to compare sales of any salesperson account from different regions and media, such as online, store, and phone.
You can download this sales management dashboard template from Smartsheet.
Sales Dashboard Template
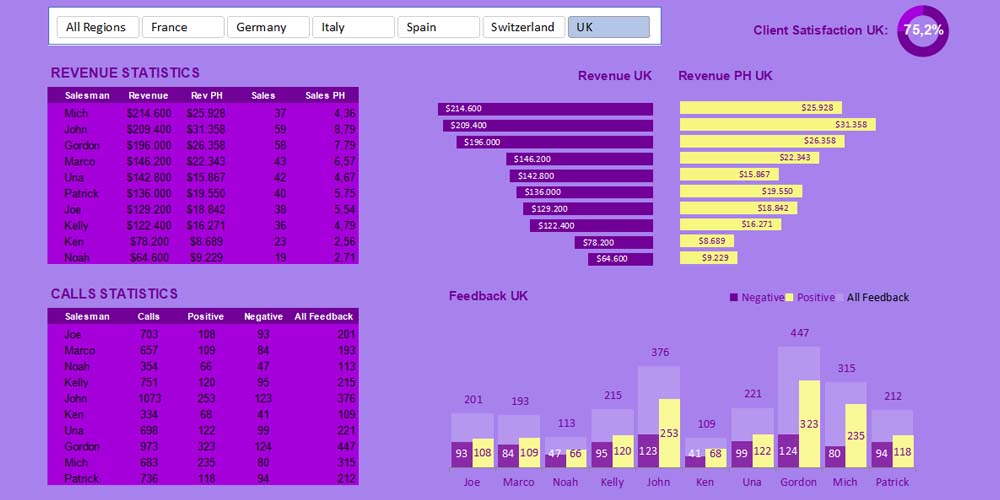
This Excel sales dashboard mainly integrates columns and bar charts to compare quickly, pulling data from several periods, items, products, and sales teams. Besides, this template showcases increased revenue through statistics, the number of deals won, and the team's progress. This document is also helpful in identifying issues and decreases in sales, which will help you to take considerations and strategies to get new leads and increase conversions.
You can download this sales dashboard template from Templatelab.
Excel Sales KPIs Dashboard
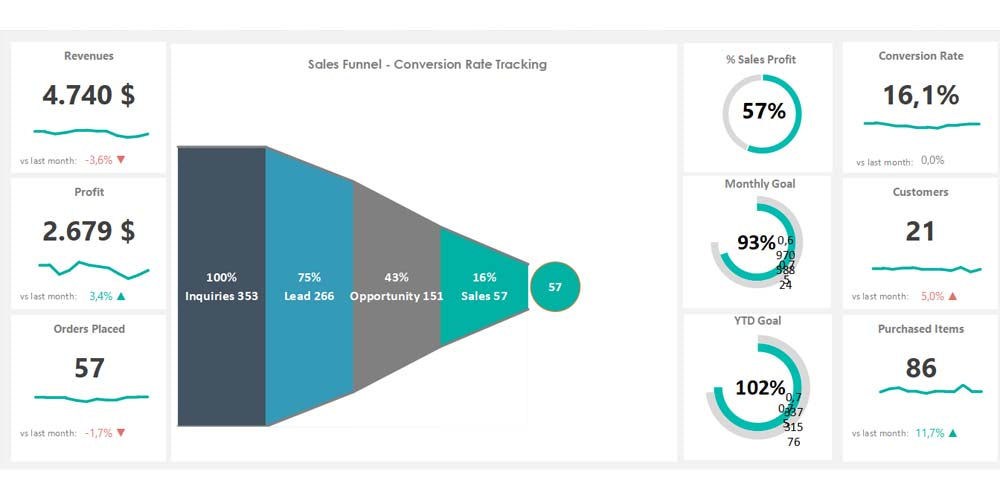
This sales KPIs dashboard gives valuable information about the sales process, paying particular attention to the sales funnel. This document uses gauge charts to easily explain percentages related to sales profits and line graphs to explain conversion rates. It also allows you to check the total value on a daily basis.
You can download this Excel sales KPIs dashboard from Exceldashboardschool.
Final Thoughts
An overview dashboard that addresses all the most important aspects of a sales process is essential to get a full picture of things you're doing well and wrong. Sometimes more than a single dashboard will be needed. For this reason, we've provided several types of sales performance dashboard examples and templates you can use for the purposes you deem appropriate.
Sales leaderboards or dashboards will offer instant insights with visually appealing colors and easy to understand interface. Your organization will save time and won't experience lost opportunities since you control everything in the sales process in a holistic view.


