
How to Use a Social Media Report Template | Free Examples
Social media function as the modern agora, serving as central squares where individuals engage in discussions on topics that resonate with a broad range of audiences seeking to express their thoughts and foster a sense of belonging. Recognizing this dynamic, businesses leverage social media interactions to not only promote but also sell their products, capitalizing on the community-oriented nature of these platforms.
But it's not as easy as it sounds. Social media efforts and interactions involve multiple factors you must meet, understand and control as a last resort. To do this, you must learn how to use a Social Media Report Template, a document that will give you insights into social media metrics and how your strategies work.
Table of content
What Is a Social Media Report?
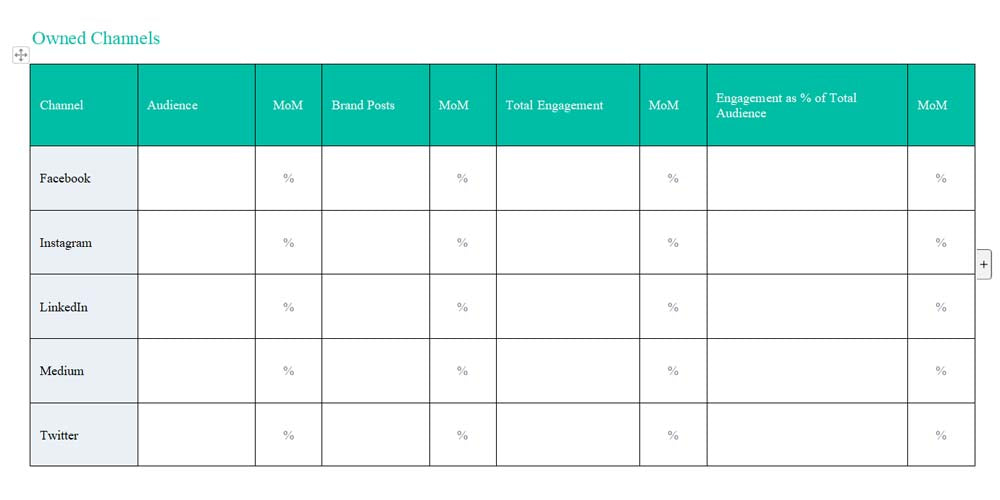
A social media report summarizes and presents all the data, information, relevant metrics, measurements, and conclusions of activities and interactions happening in your social media accounts.
This reporting tool reveals hidden data of social channels to stakeholders and marketing team members, allowing them to make decisions to improve the social performance of their accounts.
You can issue multiple reports across a specific period. The most common social media reports are:
Monthly report.
Quarterly report.
Yearly report.
A social report is built from data from different sources. The most common are:
Facebook insights. This Facebook tool allows you to meet the differences between page views through different metrics and what was your audience growth in the recent period.
Meta Business Suite. It allows you to access Instagram and Facebook engagement metrics in a single spot.
Twitter Analytics. It will provide you with key data from certain metrics related to impressions, visitors, and views.
LinkedIn Analytics. LinkedIn allows you to check data intuitively by separating analytics into visitors, updates, followers, competitors, and employee advocacy.
TikTok Analytics. This reveals videos and profile views easily by using a bar chart.
Social Media Report Benefits
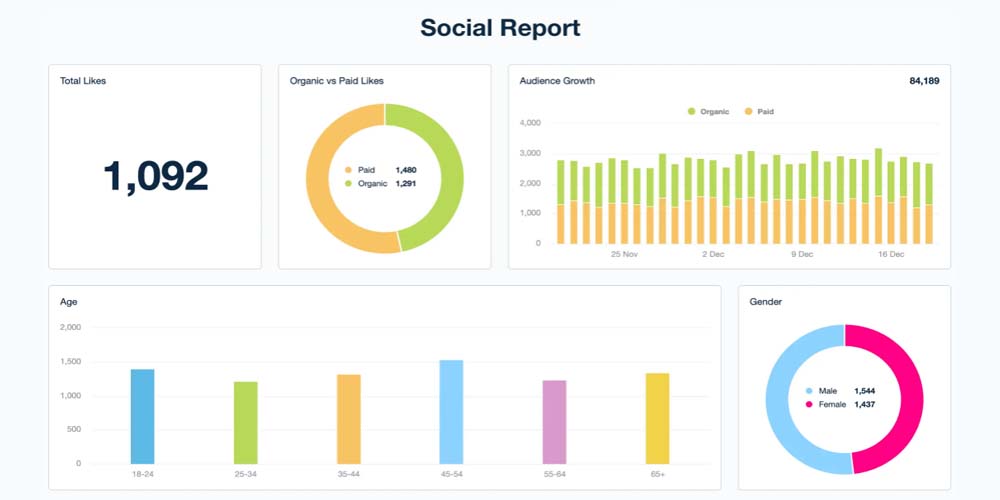
Analyzing and following metrics through different channels will allow you to create competitive reports to present to managers, owners, and other interested parties. But beyond this, a successful report of your social accounts gives you the following benefits.
It Allows You to Create Smarter Creation
There's a common understanding that crafting social media posts, videos, tweets, or any other content for platforms like SoMe is far from trivial. It demands a level of specialized knowledge and expertise to produce content that truly resonates with the intended audience. Armed with this insight, social media marketers meticulously craft social media reports as an integral part of their strategy development process.
With the insights gained through this report, you can easily identify what kind of social media publications are working and which are not. When you notice factors that make your social media publications gain relevance, you can leverage them and use them to improve even more your posts.
It Allows You to Plan a Results-Driven Scheduling
Social media reporting will clarify the best times of the day, week, and month to publish your posts and which social media channels are the right ones. It also will let you know when you should interact directly with your audience by commenting on posts in the social channel or creating a parallel interaction, such as podcasts or answering questions meetings.
All this will allow you to successfully deliver campaigns that leverage all the strong points of your interaction with audiences and avoid dates that do not bring good results.
It Allows You to Identify Opportunities and Trends
A monthly social media report will let you analyze and understand the social media performance of certain publications. With this data in your hands, and thanks to social media analytics, you can see trends in the medium and long term and where your industry is going.
Understanding trends, how often interaction spikes appear during the month, and what posts are reaching more visitors and interactors will allow you to identify opportunities you can leverage to promote specific products and services.
It Allows You to Test and Prove the Effectiveness of Your Strategy
A social media analysis report template is the best way to know whether your strategies work. You can check if your posts have succeeded by analyzing all the interactions, such as likes, shares, and viewers, together with social KPIs. You can even know if your budget or social media ads were enough.
What Should Your Social Media Report Contain?
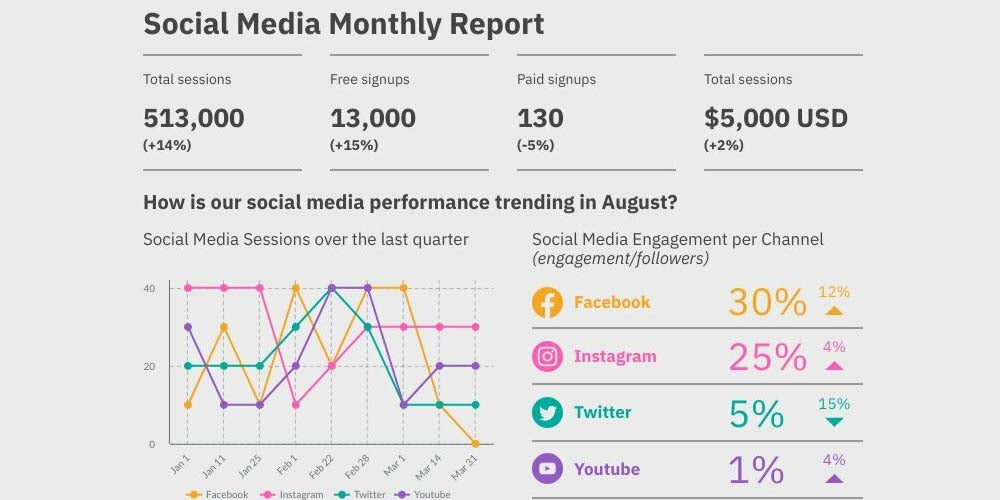
Although the data you include on your social media report will depend on your social network, tools, goals, likes, visitors, and other metrics, it would be helpful to include the following sections.
An Overview of Your Social Media Strategy
Providing a brief outline of your social media strategy will let your readers and stakeholders know what the report's frame is and what crucial points it will take. In this first part, you can briefly mention what social media reporting tools you’ll use in the next sections and which social media marketing efforts you will deploy to reach goals you’ll mention later.
Use this section to highlight the focus of your social media marketing report and whether it’s analyzing interactions, sales, visitors, and more.
Goals
After you broadly describe the general context of your report, it’s time to become more specific. To begin, define your social marketing campaign's main goals and strategies you will use. With goals at the end of the path – or maybe in the form of milestones – you can create a straightforward structure leading to your final objective.
The goals that managers and your social media team establish will depend on the extension of your campaign. Some common goals are the following:
Increase traffic to your website.
Increase brand awareness.
Boost conversions and sales.
Increase the number of visitors, likes, and interactions.
Gain marketing insights with social listening.
Improve your click for ads.
Generate leads.
In the next section, make sure to list the factors that will help achieve these goals. Also, mention the tools you'll use to track progress and the metrics you'll look at in social media reports. This will help everyone understand how well the goals are being met.
Social Media Reporting Metrics You’ll Use for Measuring Results
Your social media marketing team will likely collect much data during the marketing campaign's development. Hence, your team must think of the data you need to analyze to check whether you have achieved your goals. Furthermore, each social media channel will deliver different data with different aspects.
Some metrics that are commonly addressed in a comprehensive social media report are the following:
Number of leads generated;
Number of conversions;
Total revenue generated;
Total return on investment (ROI);
Total spend (on social ads);
Social share of voice;
Social sentiment.
Beyond mentioning the key performance indicators you will use, it’s a good idea to highlight where data is extracted from, the period you’re measuring, and how these are compared to previous measurements.
On the other hand, if you need to report on service metrics, some crucial KPIs are:
Customer satisfaction score;
Average resolution time;
Cost per resolution;
Number of tickets;
Escalation rate.
Remember that the KPIs you will use directly correlate with your milestones, goals, and objectives and the different social media platforms you utilize.
Results per Platform
You’ll want to use multiple social media platforms to broaden your reach and expand your area of influence. Consequently, it’s a good idea to separate all your analysis by platform. This way, you can present clearer results and better understand what is happening when studying the key metrics.
Some crucial information you should consider by platforms are the following:
Number of posts;
Net followers gain or loss;
Engagement rate;
Click-through rate;
Top-performing post(s).
You should compare the results you get by platform with previous reports and data from Google Analytics and other analysis platforms. It would help if you also compared them with the data of competitors. This way, you can discover trends and key insights into what will work in the following period.
Creating Your Social Media Report in 5 Simple Steps
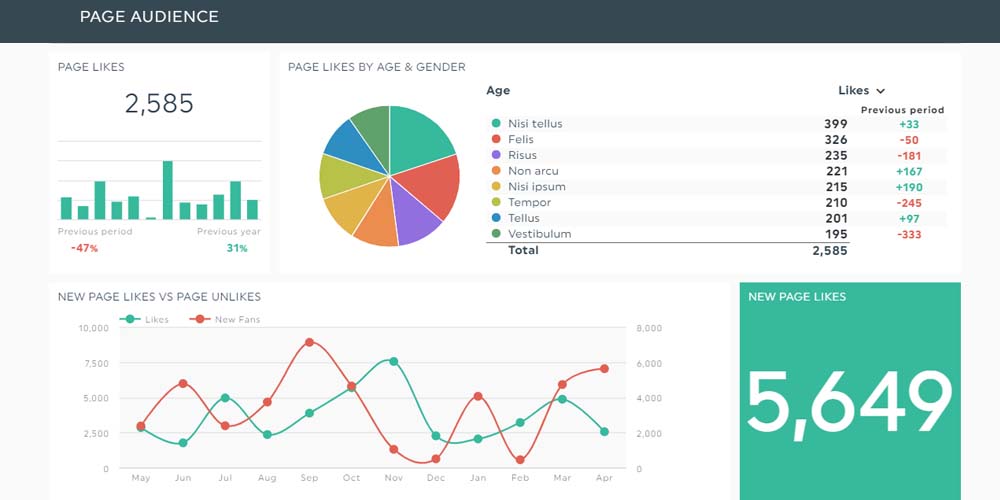
Now we mention some specific strategies and key takeaways you must apply to create a competent and affordable social media report.
1. Define Your Target Audience
The first and most important step is determining your target audience, i.e., the people you’re showing your report to. Will the document be read by all stakeholders, i.e., your boss, marketing team, or external partners?
Knowing who will read your report will allow you to use the best language possible and even directly refer to the reader. Professional social media reports always are directed to a specific audience, so reports are heavily focused and concise.
2. Focus the Reporting
This point is strictly related to the previous one. Still, it’s important to clean your report and delete all the unnecessary information that is not important to the target audience. Besides, it’s ideal to know what your report will reflect.
Will it be focused on leads and sales?
Will it be focused on engagement and awareness?
Knowing the focus of your report will keep you on one road, explaining how marketing strategies, measures, adjustments, and other factors contribute to your campaign's final goal and success.
3. Collect Your Data
Data is the core of any report since the report translates what data means and explains how data can affect the business goals. Social media data will likely come from different social media accounts and sources.
Separate sources and classify data according to your requirements and needs. Then describe what type of data you collect and its relevance to the marketing strategy.
4. Analyze Your Data
Numbers that only are numbers do not say too much about the performance of your social media marketing strategy. Social efforts must be measured, and the numbers you get analyzed to gain valuable insights into the crucial efficiency of your strategies.
Whether you’re using social media ads, social posts, videos, threads, etcetera, the key data you get will outline the top-performing posts and if ads are bringing satisfying results. Above, we’ve mentioned crucial KPIs your social media manager should consider when analyzing social platforms.
You can use dozens of platforms on the Internet to measure important metrics. Some of them are Google Analytics, Social Pilot, and Zoho Social.
5. Present Your Findings
Upon analyzing the data and getting relevant insights, you can break down conclusions and present them separately to present them to stakeholders better. In this way, you should present these conclusions in a clear and easy-to-understand document, which will finally be your monthly report.
The best to carry out this reporting process is using a social media reporting template, which will facilitate your social marketing efforts and the transcription of the data and results. In the section below, we provide some useful templates that help you to achieve your social media goals.
Social Media Report Templates
In this section, we share some templates you can easily customize, edit, and utilize in Microsoft Office and its classic applications, especially MS Word and Excel. Both apps will allow you to record and check information from your social media accounts to create affordable and accurate reports that improve your social marketing strategies.
The Microsoft Office bundle is easily obtainable here on RoyalCDKeys since we boast a reliable copy of Microsoft Office 2021 Professional Plus Retail Global that you can get immediately at the lowest price on the market.
Social Media Report Template
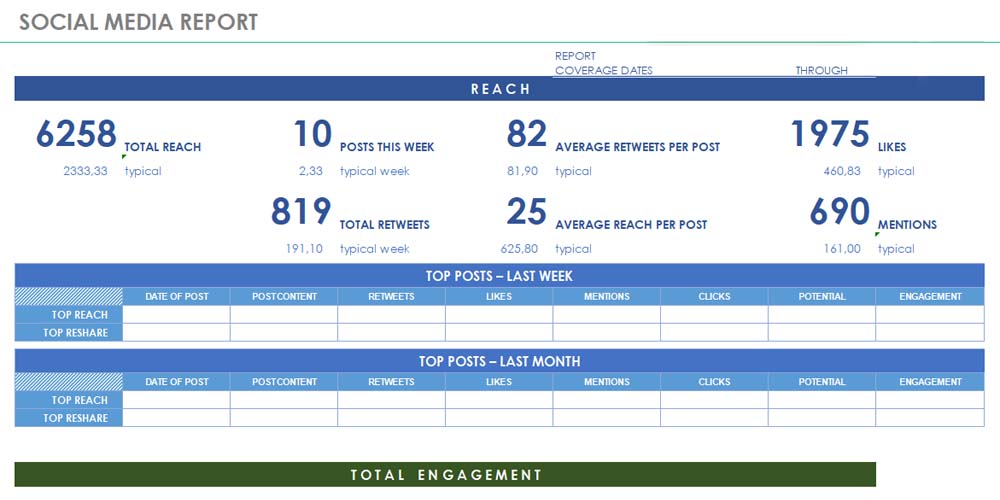
Download it from Smartsheet.
This free template is great for translating KPIs into a visually appealing social media report. Thanks to this document, your data makes sense by showcasing the number of posts created in the reporting period, audience engagement per post, follower growth, and more. Collecting and tracking these analytics in this easy-to-read report will be the tool to measure your brand’s performance for further communicating with stakeholders and other parties.
Social Media Dashboard Template
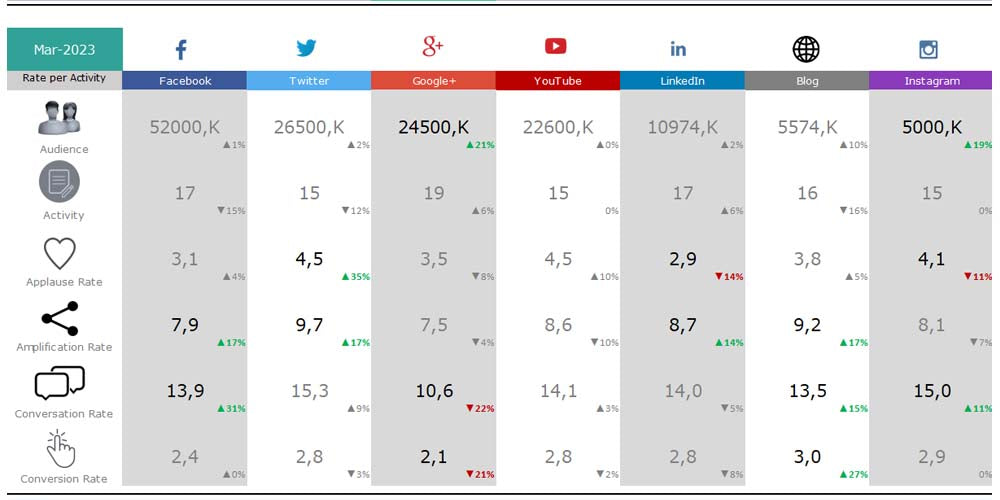
Download it from Indzara.
This free social media dashboard will help you to record, organize, track, and analyze your social media account and check how interactions change over time. Since this is an Excel document, you can add the social media you need for data analytics. This spreadsheet also contains seven relevant social media metrics – Activity, Audience, Applause, Amplification, Conversation, Revenue, and Conversion. This dashboard template automatically calculates Month over Month changes, which will help you to create reports that will leave your readers speechless.
Paid Channel Mix Report Template
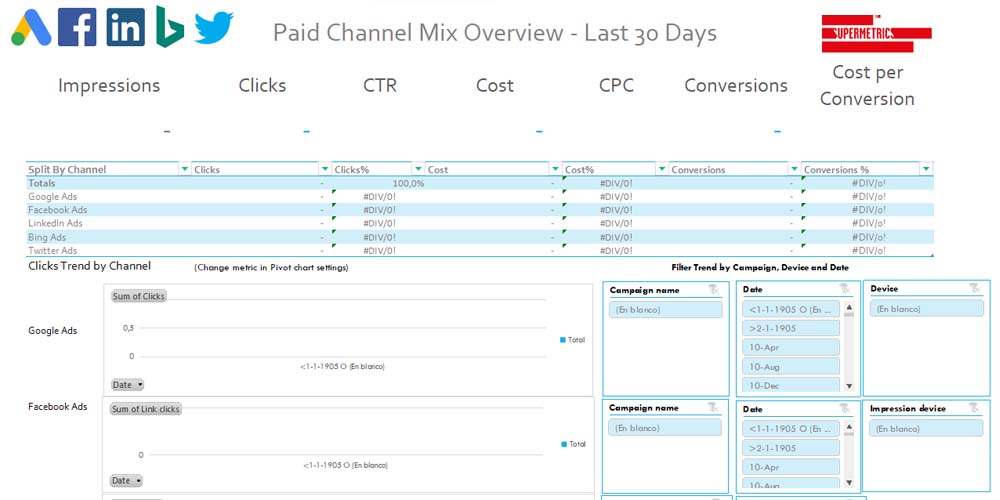
Download it from Supermetrics.
This dashboard is perfect for social media teams that need to organize, record, and track all the data from different sources in a single space. This dashboard and template allow you to analyze data and directly compare it to get revealing monthly reports that help you to increase positioning on social media and brand awareness. Knowing the average engagement by audience demographics, the percentage of growth, and your post-performance will boost your opportunities for creating better marketing strategies.
The Bottom Line
The tips and templates we've shared in the previous section are crucial documents that marketing agencies should use to ensure the success of their campaign. Any social strategy should be built into Analytics tools mentioned earlier and success metrics. These templates will help you build custom reports and data visualization to impress stakeholders and clients.
To get even more impressive results, consult the other templates we share in our blog. Most documents here will provide key learnings and valuable tools for your brand's success.


