
Guide on Creating Daily Sales Reports (With Templates for Excel)

Using a daily sales report is a powerful tool to increase your sales team's performance and generate incredible results. Sales analysis reports provide sales representatives and managers with a detailed overview of every relevant sales process.
With this guide, we will take a look at everything around sales reports: how you can write a sales report, all the different types of reports, the KPIs that you can implement, and some free templates you can use for Excel.
What is a Sales Report
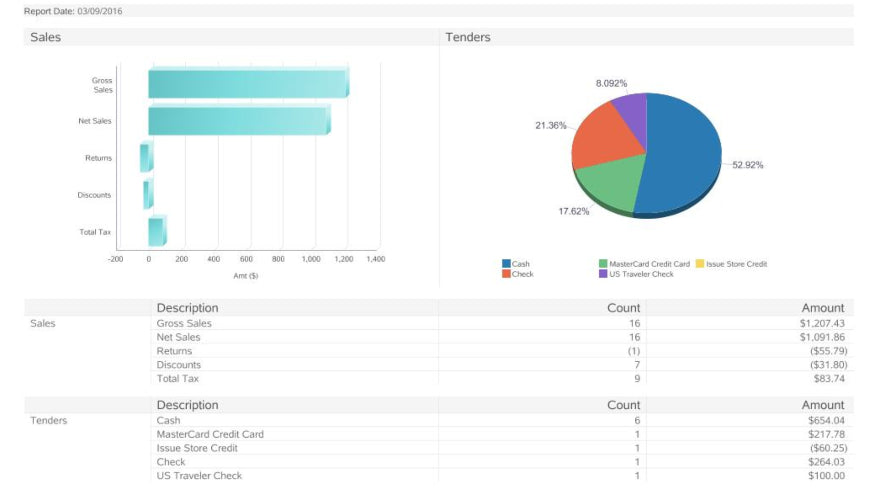
A sales analysis report outlines how the sales activities perform within the business. It can show trends in sales and analyze the stages of the sales funnel and sales executive. It also can provide a sight of the company sales in a particular period, giving you the opportunity to assess the situation in time and determine the type of behavior to perform.
Sales reports are useful for identifying market opportunities that will improve your results. There are many formats of sales reports which focuses on different aspects, like sales performance, sales target presets, sales development, and customer lifetime value.
Sales Report Function
Daily, weekly, and monthly sales reports help you to achieve your sales goals. It gives you insight into sales performance and increases future sales. It provides data about how the members of the sales team are doing, how they should continue to work, and anticipate if you need to change the course of action and sales strategy.
You can show the sales reports to employees as long as you use only a few KPIs (Key Performance Indicators) not to overburden them. Set some straightforward KPI examples and put the energy of your sales team into maximizing your profits.
But you need to know how to use these reports. If you only check progress with weekly sales reports and you have to switch the sales strategy (with its timing), you run the risk of losing a week of data as you won’t have it at the time. With daily reports, you can modify the way the sales team is doing things and reach the monthly revenue goal.
All of this data depends heavily on the sales cycle. If you have an expensive business package, your monthly report can comprise a week and a half, and your weekly reports would be similar to the daily reports of other businesses with shorter sales cycles.
Why Should I Do Sales Reports
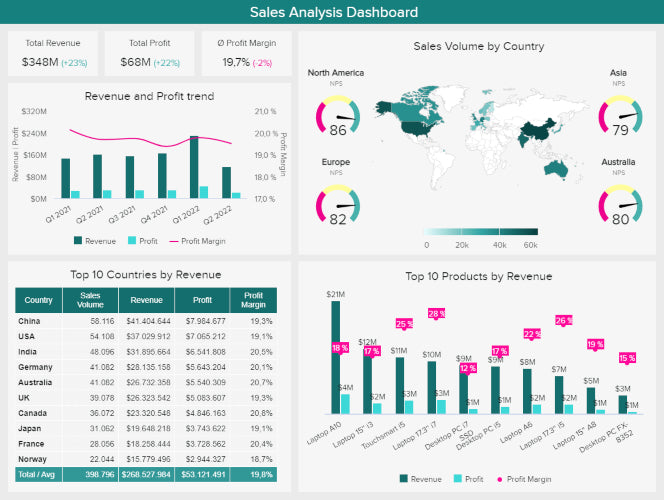
Sales reporting is crucial for your business's success, as there are many benefits of this procedure.
You can make data-driven decisions for your sales team and individual sales reps with the insight information from a sales report. You can identify if there is a sales rep that is underperforming and may need some coaching and who would benefit from regular meetings to level up and hit their quotas. You can use sales reports to find breaches and make your sales process more efficient.
It will assist you in making timely and more informed business decisions that would be vital to the success of any company's sales strategy. With regular sales reporting, sales managers can quickly iterate on what will make the company grow. You will be able to track your sales operations and adjust if any sales activity is performing below par.
Lastly, whether you do daily, weekly, or monthly reports, these can boost the morale of your entire team. Controlling and showing the sales performance of each sales team member will motivate them to do more. Sales reporting can create healthy competition and improve your team's performance to aim for the best outcomes instead of settling for an average job.
How to Create Sales Reports
The challenge in creating a successful sales report is to communicate the right data about the sales process and make your audience understand it. There are several points that you can follow to achieve such a goal.
Identify the Purpose
Ultimately, the purpose of the sales reporting process is to share sales metrics. But you have to focus on the information that helps you or the company to achieve specific objectives.
Setting a clear purpose for your sales report will help you to analyze and gather the right data and determine the scope of your report.
Keep in mind that reports with different set periods would differ from each other and should be shared with different sectors. So, monthly sales reports should be shared with top management, while weekly sales reports and sales target analysis should be shared with the team.
Know Your Audience
The next step is to define your audience. Consider who will read and understand it before writing.
The marketing team head would be interested in details like which marketing campaigns were the most profitable. However, a CEO or any other decision-maker would want to see the big picture, like sales growth, revenue growth, and how all is affecting the company overall.
Gather Sales Data
Now you need to make a proper sales data recollection. You will need to gather relevant data, filter information, and analyze it.
Start by outlining the sales metrics you want to include in your report and any other trend you think matters. This will include core KPIs, the number of items sold, team performance, profits, net sales, and customer acquisition costs. Other metrics that you may consider relevant to include in your sales report could be sales growth, new opportunities, team performance, regional sales, and any other metric that can be important to show.
You can improve data accuracy by filtering or cleaning any duplicate records and focusing on certain areas. Then, you should determine the time period. It is recommended to take at least two different periods and compare previous data with the current one.
Visualize Your Data
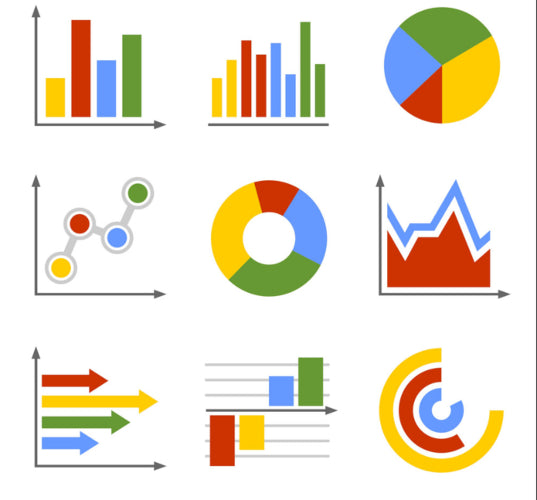
As we said before, the real challenge of sales reporting is to communicate your data properly. The way you present data is as important as the report itself. Data visualization will help you with that.
Expert dashboards with real-time data would be useful to stay up-to-date when sharing insights. Use charts and graphs to illustrate the impact of important data. Visualizing helps make your sales report easy to understand. It can highlight important challenges in key sales metrics and trends that might influence sales performance in the upcoming months.
Justify and Explain Your Numbers
Data and numbers can sometimes lead to erroneous interpretations. It is important to always contextualize your data instead of just delivering a bunch of numbers to your audience.
Add an Executive Summary
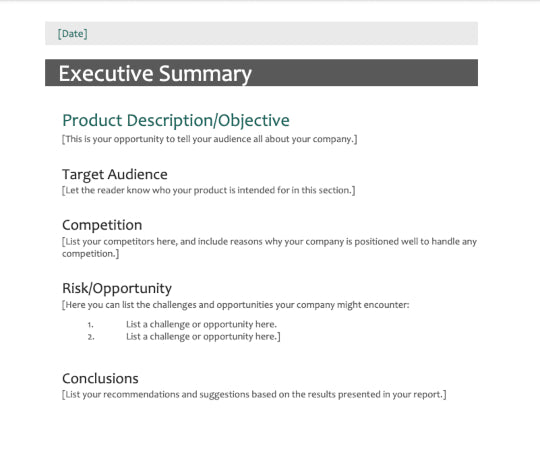
It is always a good idea to include a written summary before presenting the data and sales results. It will summarize the key insights you have drawn, and it is always necessary to have a summary paragraph that outlines the points because you won't have the time to explain to the CEO all the details inside the sales report.
Set Your Sales Report Timeframe
The timeframe of your reporting will depend on your sales objectives and how frequently you will need to bring an update to your team or management.
We mentioned it, and we will explain these three ways that you can set the timeframe.
Daily Sales Report
A daily sales report will track the sales activities of each business day. It increases your rep's accountability, can encourage productivity, and includes sales performance metrics like:
- Number of outbound calls
- Duration of each outbound call
- Number of sales opportunities
- Number of proposals sent
- Number of emails sent
Weekly Sales Report
A weekly sales report calculates the weekly performance of individual sales reps and the team. It allows sales leaders to check which sales reps are on track to hit the set KPIs. Weekly sales reports can track metrics like:
- Call or Contact volume
- Lead-to-opportunity ratio
- Lead conversion ratio
- Number of appointments set
- Number of closed deals
- Sales volume by channel
- Total sales by region
Monthly Sales Report
A monthly sales report will summarize your performance over the month. It helps to determine how effective your strategy was so you can tweak it if necessary. The monthly sales report can track metrics like:
- Number of deals at each stage of the pipeline
- Number of scheduled meetings
- Length of the sales cycle
- Average close rate
- Average deal size
- Sales volume
Types of Sales Reports
There are many different kinds of sales reports, and different sales teams in the same company may use different sales report templates to showcase a variety of data.
Not only do reports cover a specific time period but also different steps in the sales process.
We will show some of the most common sales reports you may encounter and use.
Sales Pipeline Report
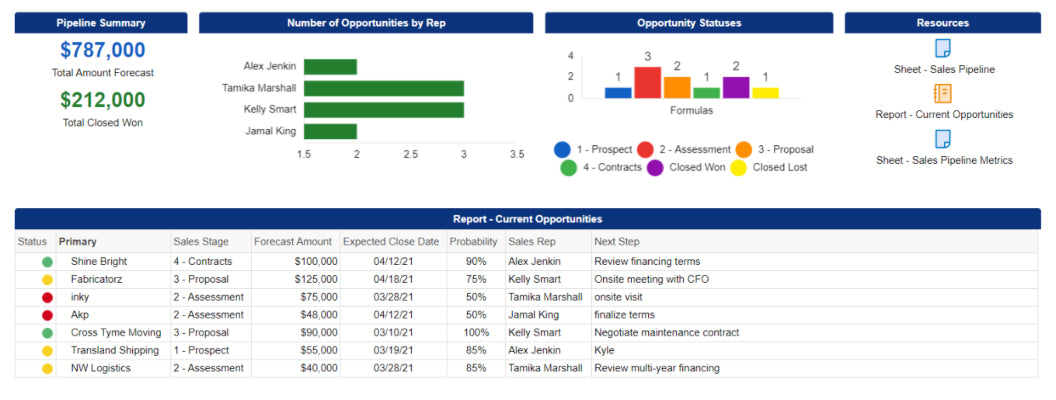
The sales pipeline report shares the value of your pipeline and the number of deals in each stage. It highlights how many can be closed, how many could be lost, and how this might impact the overall revenue of the company.
Sales managers and sales leaders need to know how each deal is doing. To forecast this in an accurate way, make sure your sales reps are doing their job to guarantee a realistic sales pipeline.
You can also identify certain actions your sales reps should take to move prospects on every stage of your sales pipeline, the number of prospects, and how close they are to getting to their targets.
Conversion Sales Report
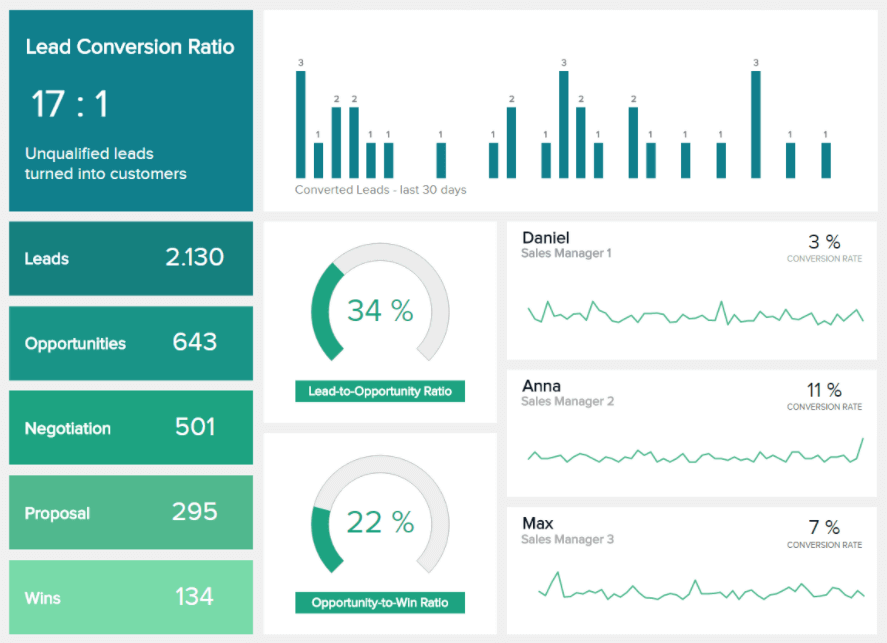
A sales conversion report evaluates the skill of your team to convert prospects into leads, and those leads convert into actual customers.
You can identify where your team performs better and where it is lacking in the sales cycle. You can scale the tactics that are already working if your team has a consistently high conversion rate or find areas that need improvement. It reveals the efficiency of your strategy on an operational or team-wide scale.
Average Deal Size Report
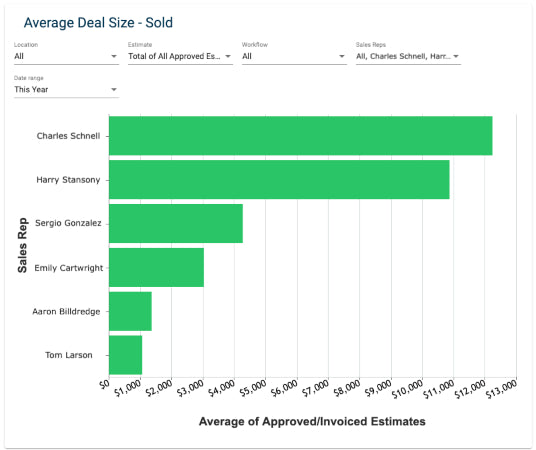
An average deal size report helps to predict revenue. It provides the basis for your sales reps' quotas and lets them know the number of deals they're expected to achieve.
It sets expectations and milestones for your sales cycle. You should always monitor the average deal size, as it is crucial to your sales operations.
Average Sales Cycle Length Report
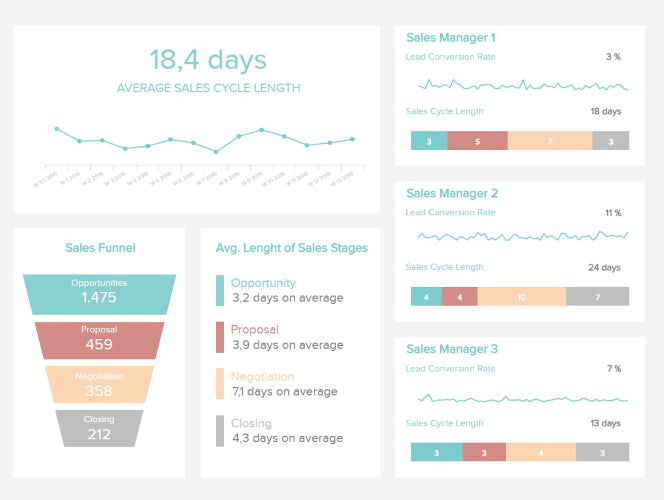
It is the average time it takes a sales rep to close a sale. This shows the sales performance of each rep and the overall efficiency of your sales process.
Set an ideal timeframe to use as a benchmark. It should display how long a rep takes to work through your sales cycle. You can evaluate their sales efforts and identify areas that need some coaching. If there are a lot (or all) of reps that can't keep pace with your set target, then you should probably tweak your operations. It can help you find flaws in your approach or management and fix these issues.
You can also create some sort of contest to foster healthy competition and improve teamwork towards a common goal.
Marketing Collateral Usage Report
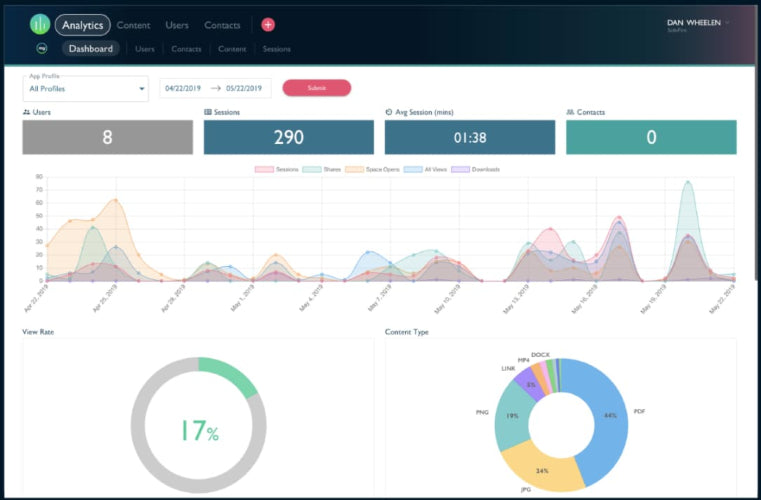
Marketing teams may expect representatives to put the collateral they create to good use. It helps reps to move prospects through the sales process more quickly. Although, some collateral could be irrelevant to your rep's prospects.
With this report, you will get a notion of which marketing content works. And letting the marketing team know will give them an insight into which content could be more useful. It determines which marketing collateral will get the most traction with prospects and which can use a refresh.
Won and Lost Deals Analysis Report
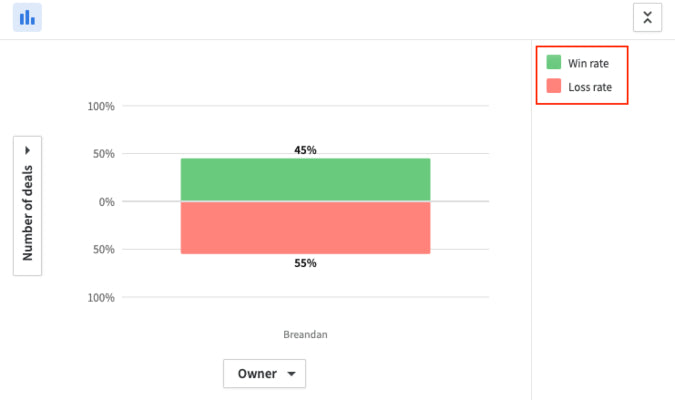
This type of report is a good way to spot overperforming and underperforming reps. You can check which one helps to close deals with other representatives or if someone has the same energy and will but is falling behind on closing deals and needs some help or coaching.
With this report, you can evaluate performance against variables like company size, sales reps, sales teams, and product type.
Churned Customers Report

All the companies will experience customer churn. But having a higher rate than your company or industry average may reveal larger issues.
You will be able to identify in time which can be the issue: quality, pricing, service, customer experience, etc. You should speak with your customers to understand their problems and fix them. It will improve customer retention and their overall experience.
Sales Call Report
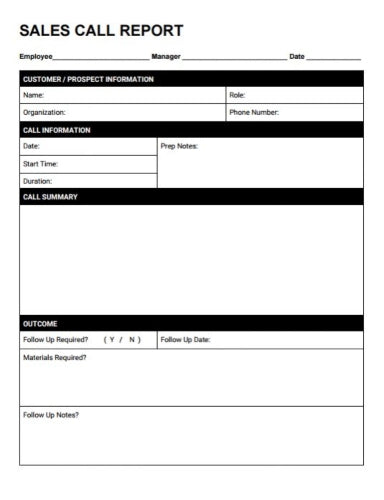
With a sales call report, you can track the effectiveness of your reps and how many calls or visits they make to prospects.
You'll want your reps to close a healthy number of deals measured by the number of prospects they meet. You can identify gaps in your team or see which tactic is working and share it with the rest of the team.
It also can help to segment data. If a specific industry responds well to your services and products, you can tell your team to narrow their call list and prioritize the highest converting segment.
Lead Response Time Report
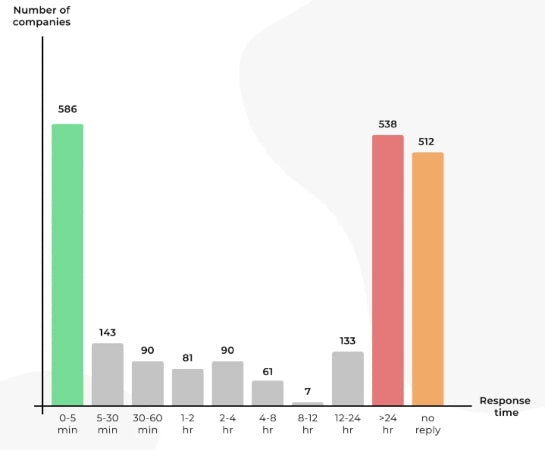
Lead response time should be relatively quick, regardless of the length of your sales cycle.
It measures the average time it takes for a sales representative to follow up with the lead. Also, you can compare this metric with industry benchmarks. Implementing strategic decisions and prioritizing your team's workload will help you attain this goal.
Revenue Report
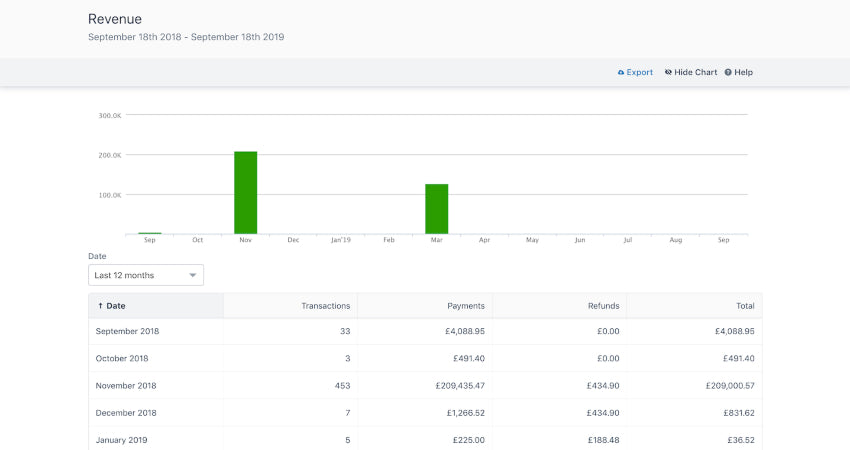
It complements the average deal size report that can help you and your reps see how their work impacts the company's bottom line.
It is a breakdown of new business and renewals, as also which reps contributed to each of these.
Forecast Report
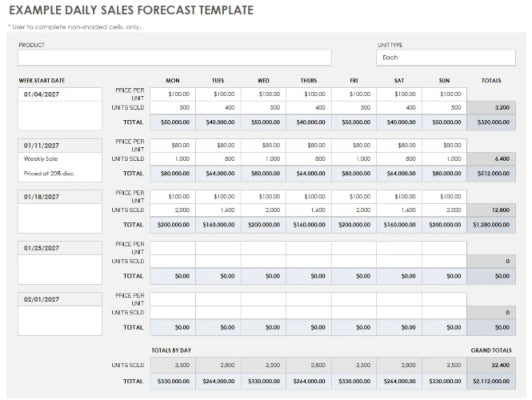
It is a detailed report that estimates how much a company, team, or individual rep will sell in a certain period of time (day, week, month, quarter, or year).
A sales forecast uses predictive analytics to analyze previous and current data and generate accurate predictions. Businesses can spot any potential slowdown in sales as well as other bottlenecks that should be addressed in time. It also identifies weaknesses in the pipeline that can be appropriately optimized.
Opportunity Report
This report uses the opportunity score from 0 to 99 to rate the leads and see which are higher, meaning they are closed to becoming new customers (or the opposite, which leads are still far away at the moment).
With this kind of report, you can prioritize these leads and focus your monetary and human resources on who is more likely to convert.
Performance Report
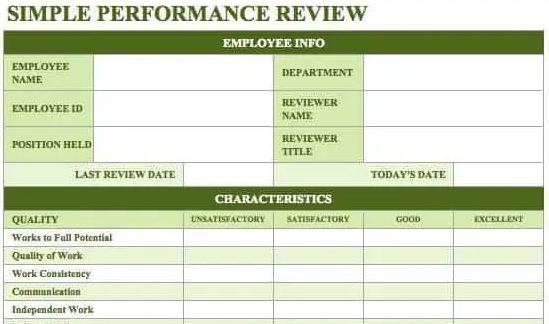
This tool analyzes and tracks the performance of representatives in terms of productivity and profitability in general.
It can include many metrics, such as leads generated, opportunities closed, and revenue generated, among other metrics that you may consider relevant. A sales manager can spot a rep who is underperforming and offer additional training or coaching to improve their work.
KPIs You Should Consider For Your Sales Reports
Sales reports are composed of many Key Performance Indicators (KPIs), and you may consider a bunch of those together to complete your report. The best reports are done with the perfect mix of these metrics, but not every KPI is recommended for every sort of sales report.
There are some that you should consider daily reports, while others are more commonly used in a weekly sales report.
Outbound Calls
Cold calling is an invaluable KPI that can tell you which weekday is the most promising to do your outbound calls. Usually, one should avoid weekends, Mondays, and Fridays, but it is useful to set your own benchmarks. You can set daily targets and track progress during each day.
Sales Volume by Channel
It shows what physical areas and techniques of customer acquisition are driving the most revenue.
The total sales volume eases where you should prioritize your sales efforts and adjust them accordingly.
Sales Opportunity
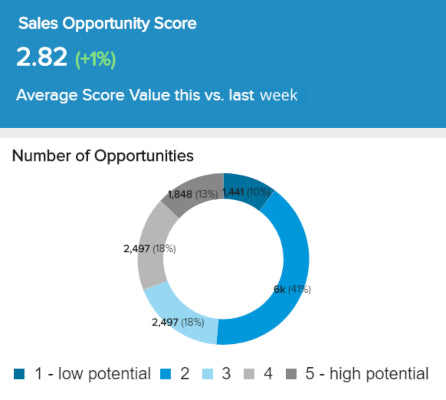
You can standardize value to your opportunities with scoring models since there are different classifications depending on the potential.
With the help of this metric, you can allocate your resources more effectively and invest more time in opportunities with a high potential. You can create an effective weekly strategy and execute your action plan on areas where your sales representatives should focus their time and energy.
Revenue Closed
With this metric, you will be able to see the trends of your reps over the course of some weeks.
It works better on a monthly basis, as it provides more meaningful insight data of what times of the month your representatives tend to close sales, increasing the precision of your future projections.
Upsell and Cross-sell Rates
This metric compares the result of each rep and gives an evaluation on a weekly basis of the weakest and strongest points.
You can educate some reps to implement the same tactics as a more successful representative. It may increase not only your sales numbers but also customer loyalty and satisfaction.
Customer Lifetime Value
As another invaluable KPI, it shows how much is expected to be earned per customer and monitors it on a weekly basis to check if the average is decreasing or rising.
Average Purchase Value
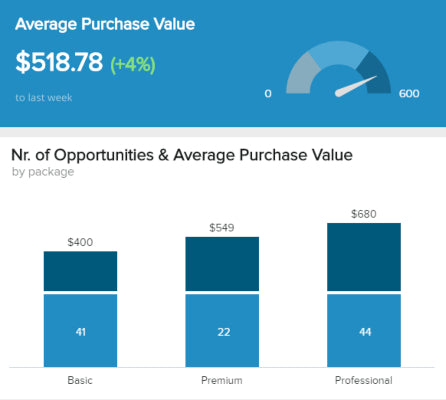
Sales analytics should include average purchase value. You should compare this KPI with the number of opportunities on a weekly basis, where you can immediately identify direct correlations between the two.
The results will be useful to check if you need to put some additional incentive for your clients to improve your chances of selling higher-end products or services.
Client Meetings
It's hard to get meaningful conclusions from the number of meetings being attended by each rep with a daily report, but a weekly timeline will show a different story.
Successful sales representatives are going to have constant meetings, and this metric will show you how they're doing.
Lead-to-Opportunity Ratio
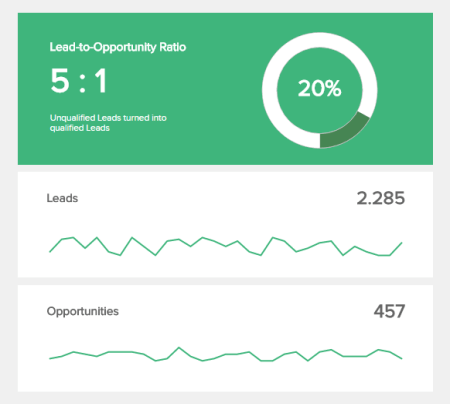
Tracking this KPI will let you evaluate the number of qualified leads against how many unqualified they are.
A qualified lead is an opportunity that will get a meeting in person or a call, opening favorable circumstances. The lead-to-opportunity ratio will set a baseline of how many leads you need to make to reach your target growth.
Over the course of weeks, you can define which of your potential clients convert the most and modify sales and marketing tactics accordingly.
Opportunity-to-Win Ratio
With this KPI, you can see how effective each of your salespersons is at closing their opportunities.
If one is better than the others, it's possible that it's getting the best leads or it has some skills that could educate the rest of the team. Also, if a representative isn't closing at the same rate as their teammates, it could be just a fluke, but they also might need help if the trend continues going on during the next weeks.
Lead Conversion Ratio
This KPI tracks the number of leads that end up as paying customers. It is one of the most vital metrics for sales teams, as it gives the baseline to define the number of leads the team needs to reach to achieve business objectives. A low lead-to-conversion ratio will warn you of possible weaknesses in your pipeline.
Rate of Return
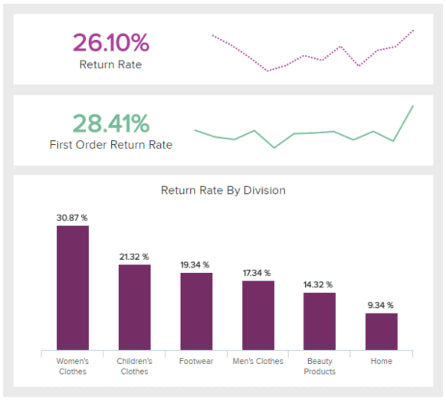
With the rate of return, you can identify what the customers are thinking about your merchandise.
Tracking this value weekly can help you to decrease the number of returns in the future when you investigate why these items are being returned and what you can do to improve the overall offer.
Total Sales by Region

This metric allows you to see which stores are performing well. You will be able to check these values and introduce various other marketing activities based on the results provided.
If you see that X location is outperforming the others by a big margin, see what makes it tick, and think of investing more resources to grow even further.
Total Volume of Daily Sales
It goes straight to the point on the number of sales achieved daily. Daily volumes can stipulate which weekday performs the best, and use this to your advantage.
Your objective should be to keep this number growing. But whenever it goes down, investigate why it happened and adjust your strategies.
Average Transaction Size
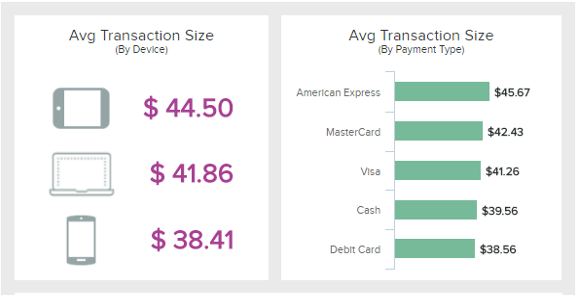
This KPI will vary depending on the retail store type. But doing some evaluation can tell you how to adjust your advertising and online shop to match your customer's needs. It is very useful to track as it can say much about customer behavior by looking at the device or payment type.
Total Orders and Average Units Per Customer
It is not only useful for sales, but it is a metric that will help retailers on a daily basis since they need to keep an eye on the number of orders they receive each day to ensure profitable results.
The average number of units per client measures how many products are purchased by customers on average, which can set the tone of the purchase trends. It also gives you enough data to measure your sales even more accurately.
Daily Sales Report Templates for Microsoft Excel
There is plenty of software around the internet that you can use to make your sales reports. But you can go in an easier and more direct way by using Microsoft Excel, for which there are many free templates to test, and we will see the ones that are more focused on daily reports.
If you need a key for Excel, you can get one on RoyalCDKeys at a low price. It comes with the latest version of Office and the whole package. So you won't be buying Excel but also Word, PowerPoint, and the rest of the programs that come with Office 2021.
Daily Sales Report Template
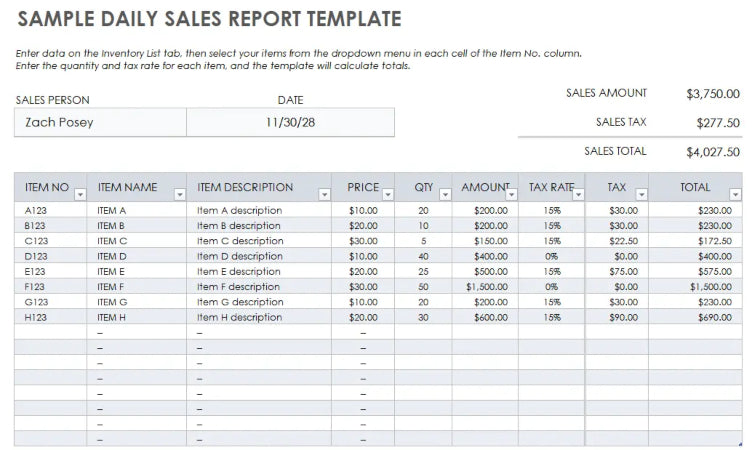
This template is appropriate for retail stores and small businesses that need to track day-by-day sales. There already is some sample data that you can use as a guide throughout the making of your own report. You can get it for free on the Smartsheet website.
Restaurant Sales Report Template
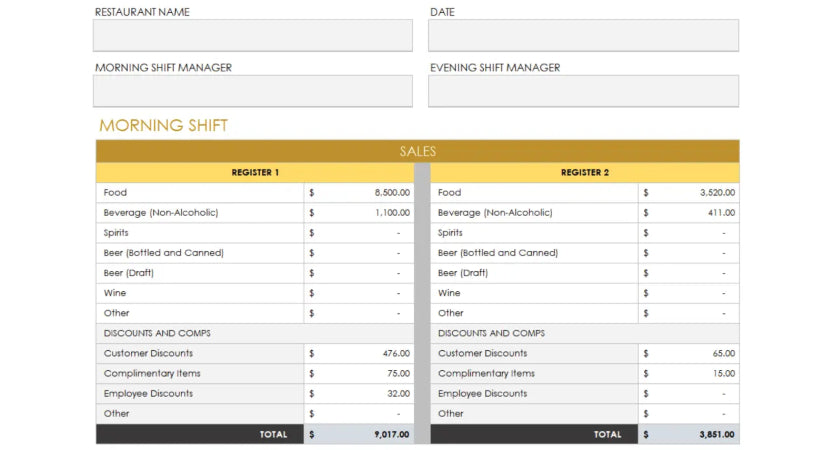
It is focused on restaurants, and you can create an itemized sales report showing subtotals for different shifts, as well as daily totals. The template also subtracts complimentary items and discounts from your gross sales to define net earnings. In addition, you can get a breakdown of credit cards, certificates, and cash settlements for the day. You can download it from Smartsheet.com.
Hotel Sales Report Template
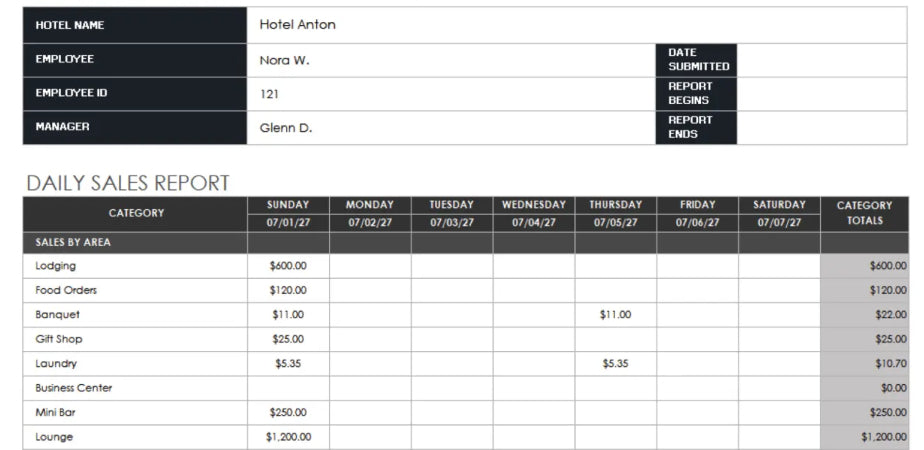
With this spreadsheet template, you can track hotel sales and occupancy on a daily basis. You can compare the current sales with budgeted amounts from previous periods. It also shows sales per segment for transient and group travelers, which you can edit to reflect the type that your hotel serves. There are many other metrics that you can monitor, and you can get this template for free from Smartsheet, too.
Salon Daily Sales Report Template
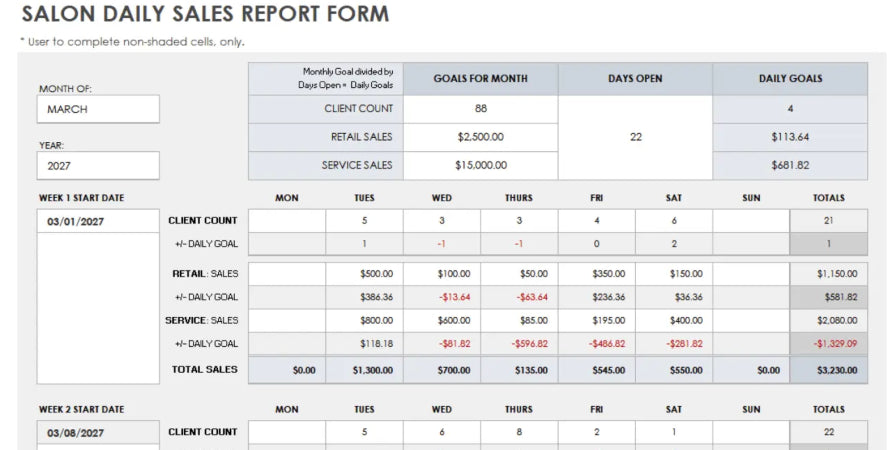
Within this template, you can compare daily salon transactions with your goals. For each weekday, you can enter the number of customers you served, total sales, and the variance between those numbers and goals. You can get this template from Smartsheet.com.
Daily Sales Calls Report Template
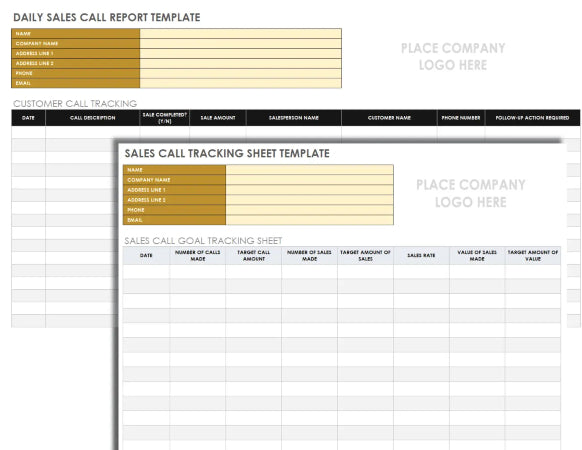
You can use this template to track customer calls and measure your daily sales activities with your objectives. On the first tab, you put all the daily sales data, while on the second tab, you can compare the actual against target numbers of calls made, sales sealed, and sales value for each day. This template is also free on Smartsheet.
Conclusion
We hope this guide has cleared all the doubts about sales reporting, its importance in making one, and the templates that may help you if they fit your needs. The key to a successful sales report is the presentation, as the ultimate goal is to make it understandable for anyone (or, at least, anyone you want to). Remember you can adapt many of the metrics for a set period of time (daily, weekly, monthly, yearly, quarterly).


